apps
With collaborators, I have designed several web-based applications using the R package, Shiny, to collect and visualize data.
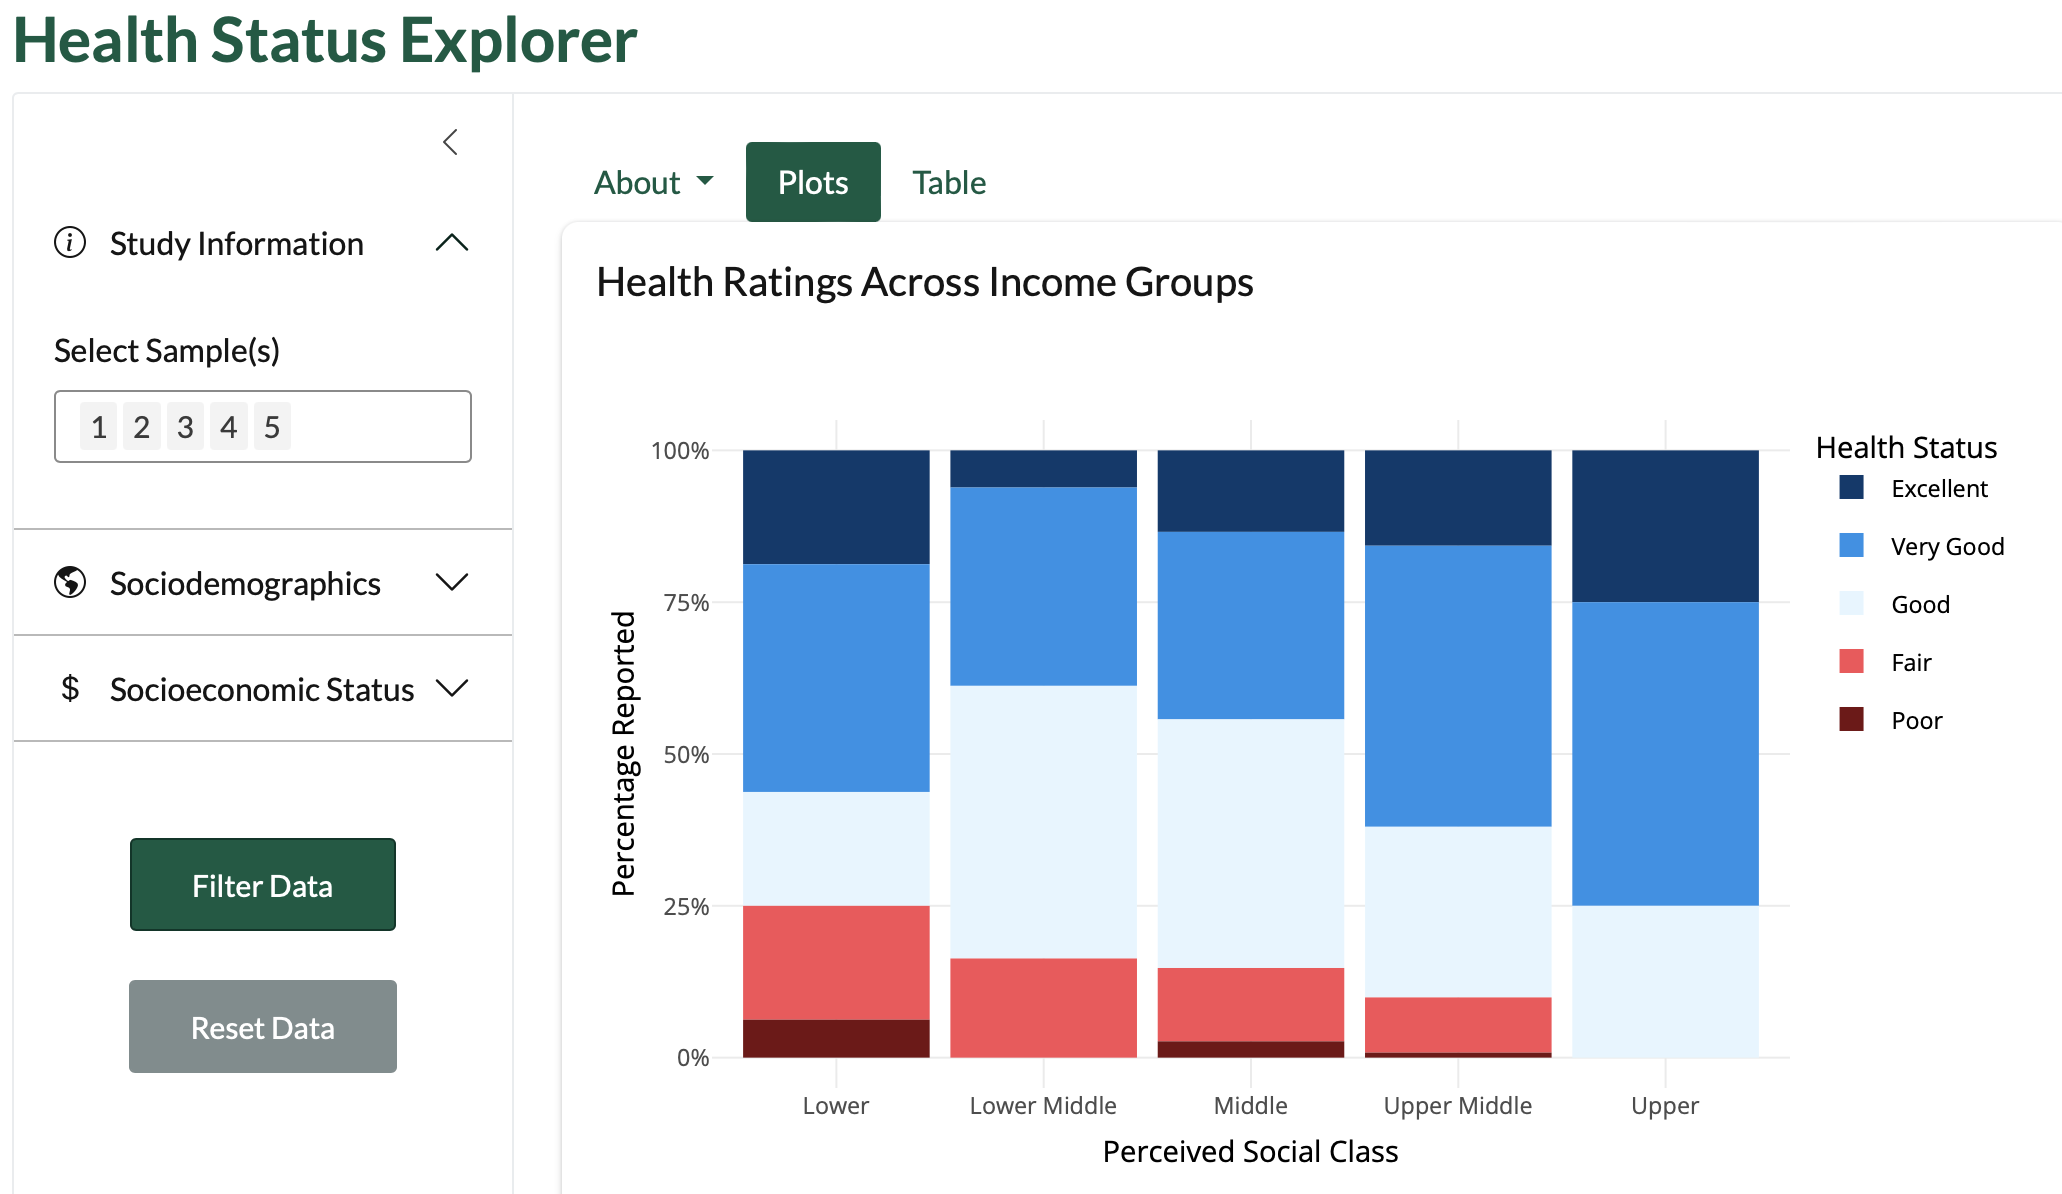
health status explorer
Zach Spiegel, Andrew Silhavy, and I co-developed the health status explorer using pooled data from Cohort 10 of the public health research stream in the First-Year Research Immersion (FRI) program. The application allows users to filter data based on certain sociodemographics to examine health status inequities.
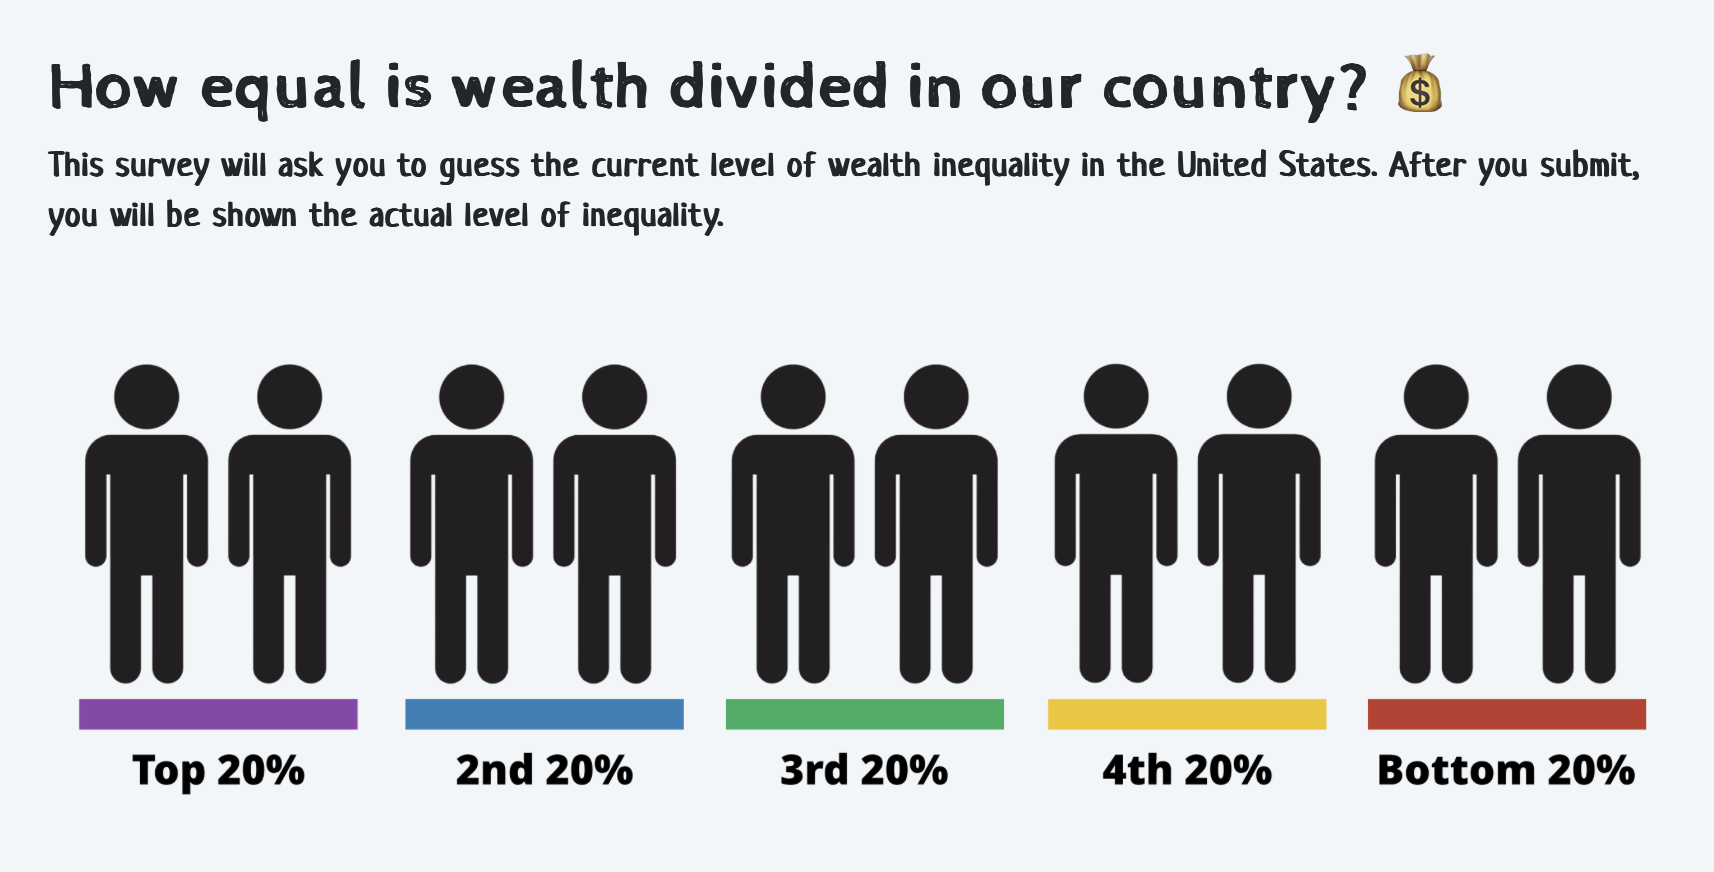
inequality perceptions
Zach Spiegel and I co-developed the inequality perceptions app using surveydown to visualize perceptions of wealth inequality in the U.S.
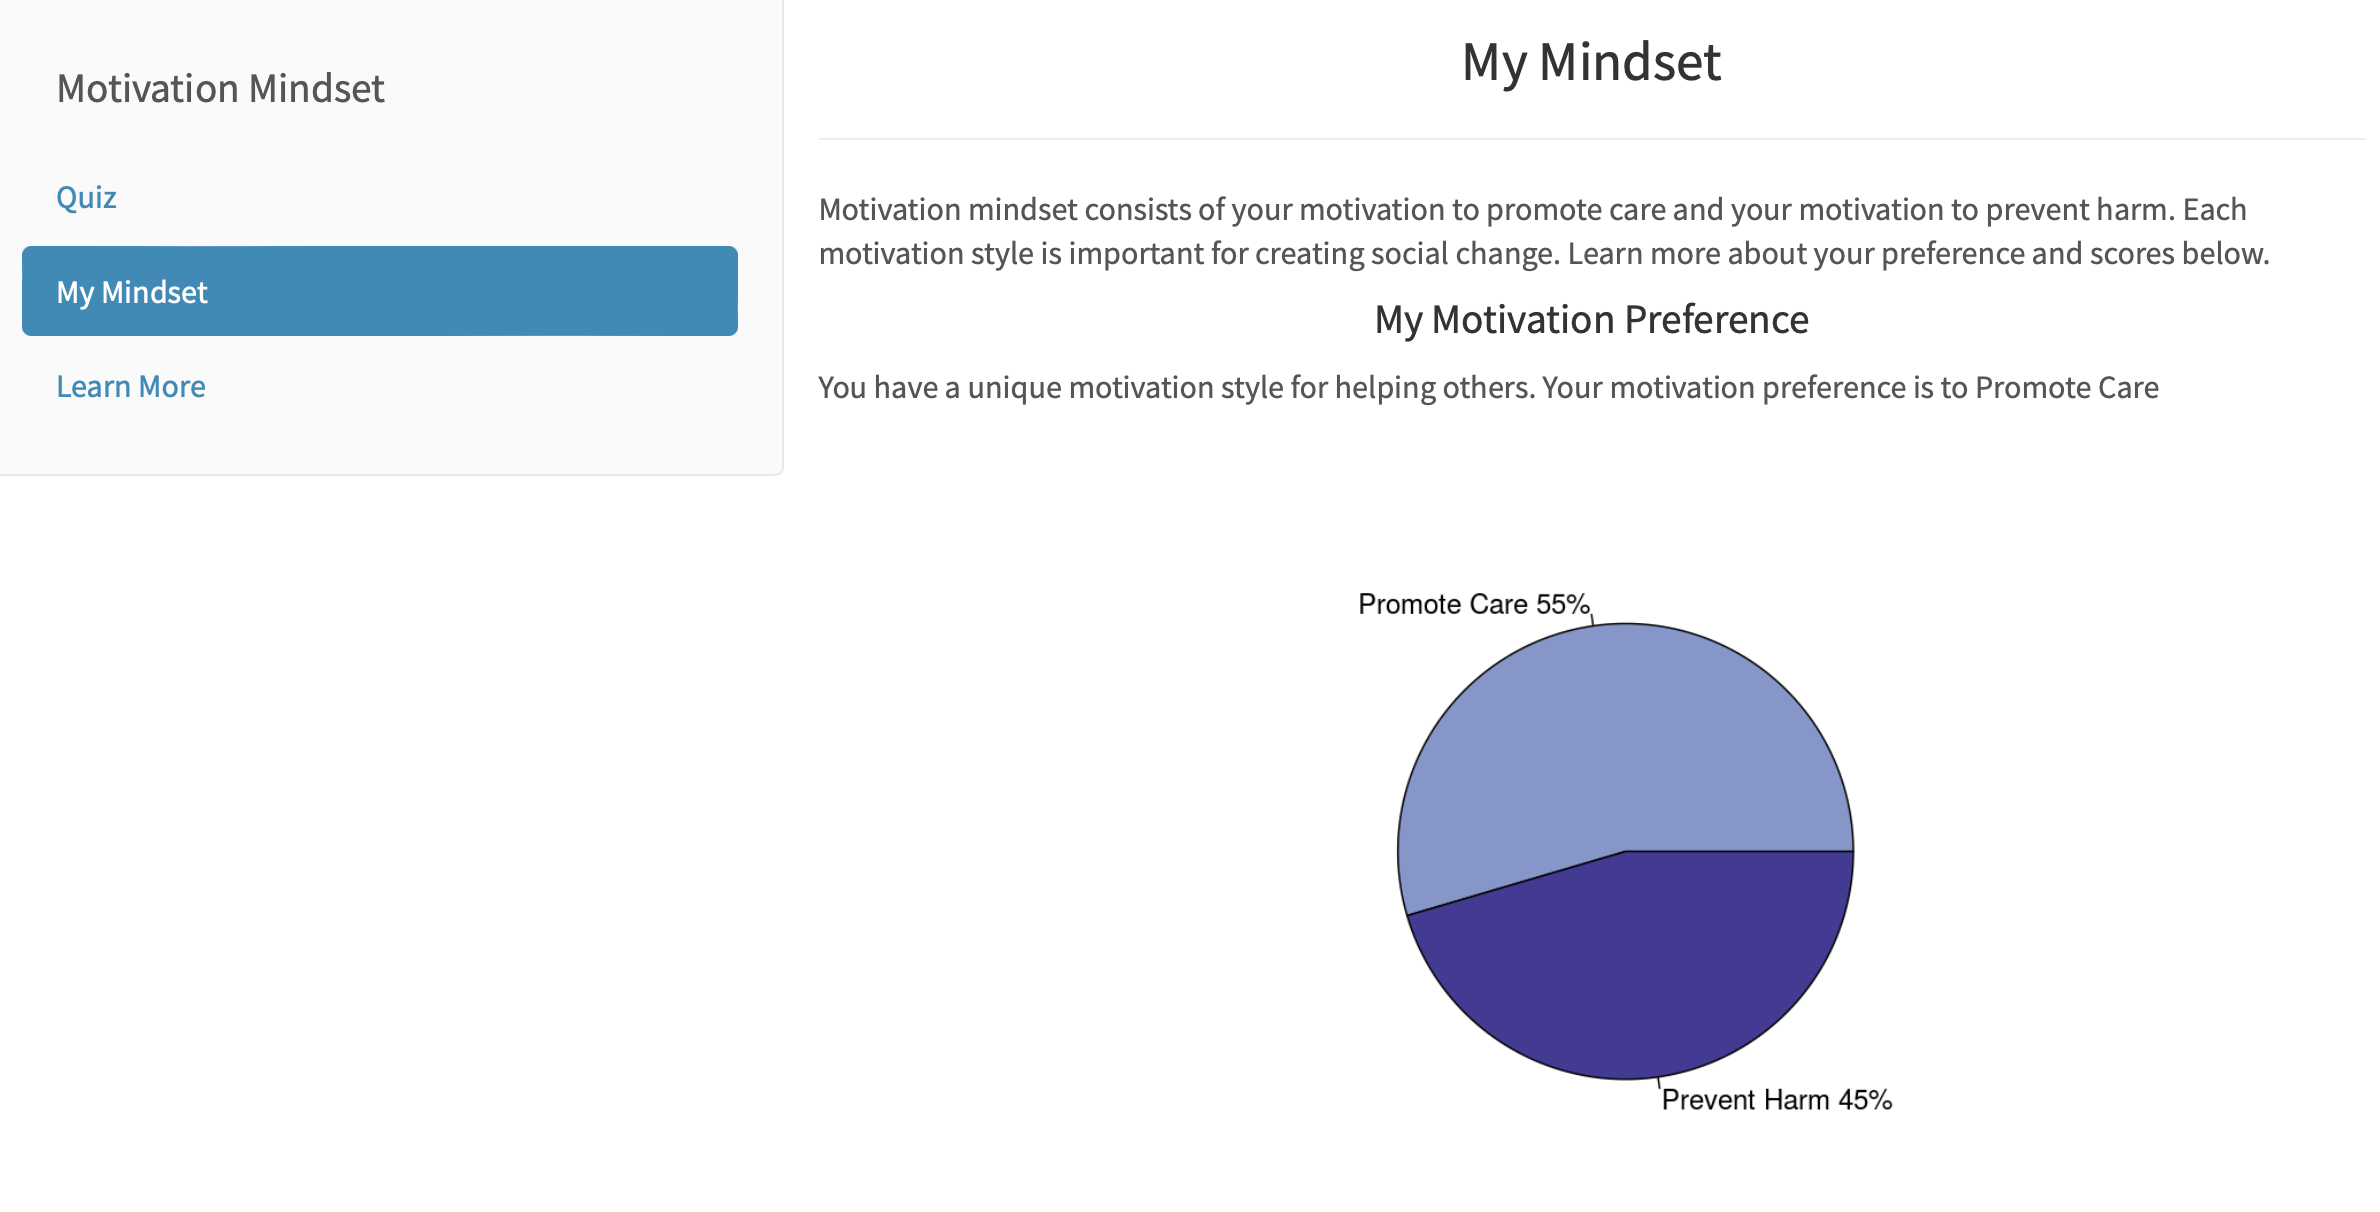
self-assessment of prosocial motivation
Jordan Booker and I extending regulatory focus to various prosocial contexts. We developed items for a new prosocial regulatory focus measure to assess prosocial promotion motivation and prosocial prevention motivation. Bryan Acton and I developed a web-based survey using R Shiny to compute mindset results instantaneously. Our team is piloting the app and measure as part of a research study.
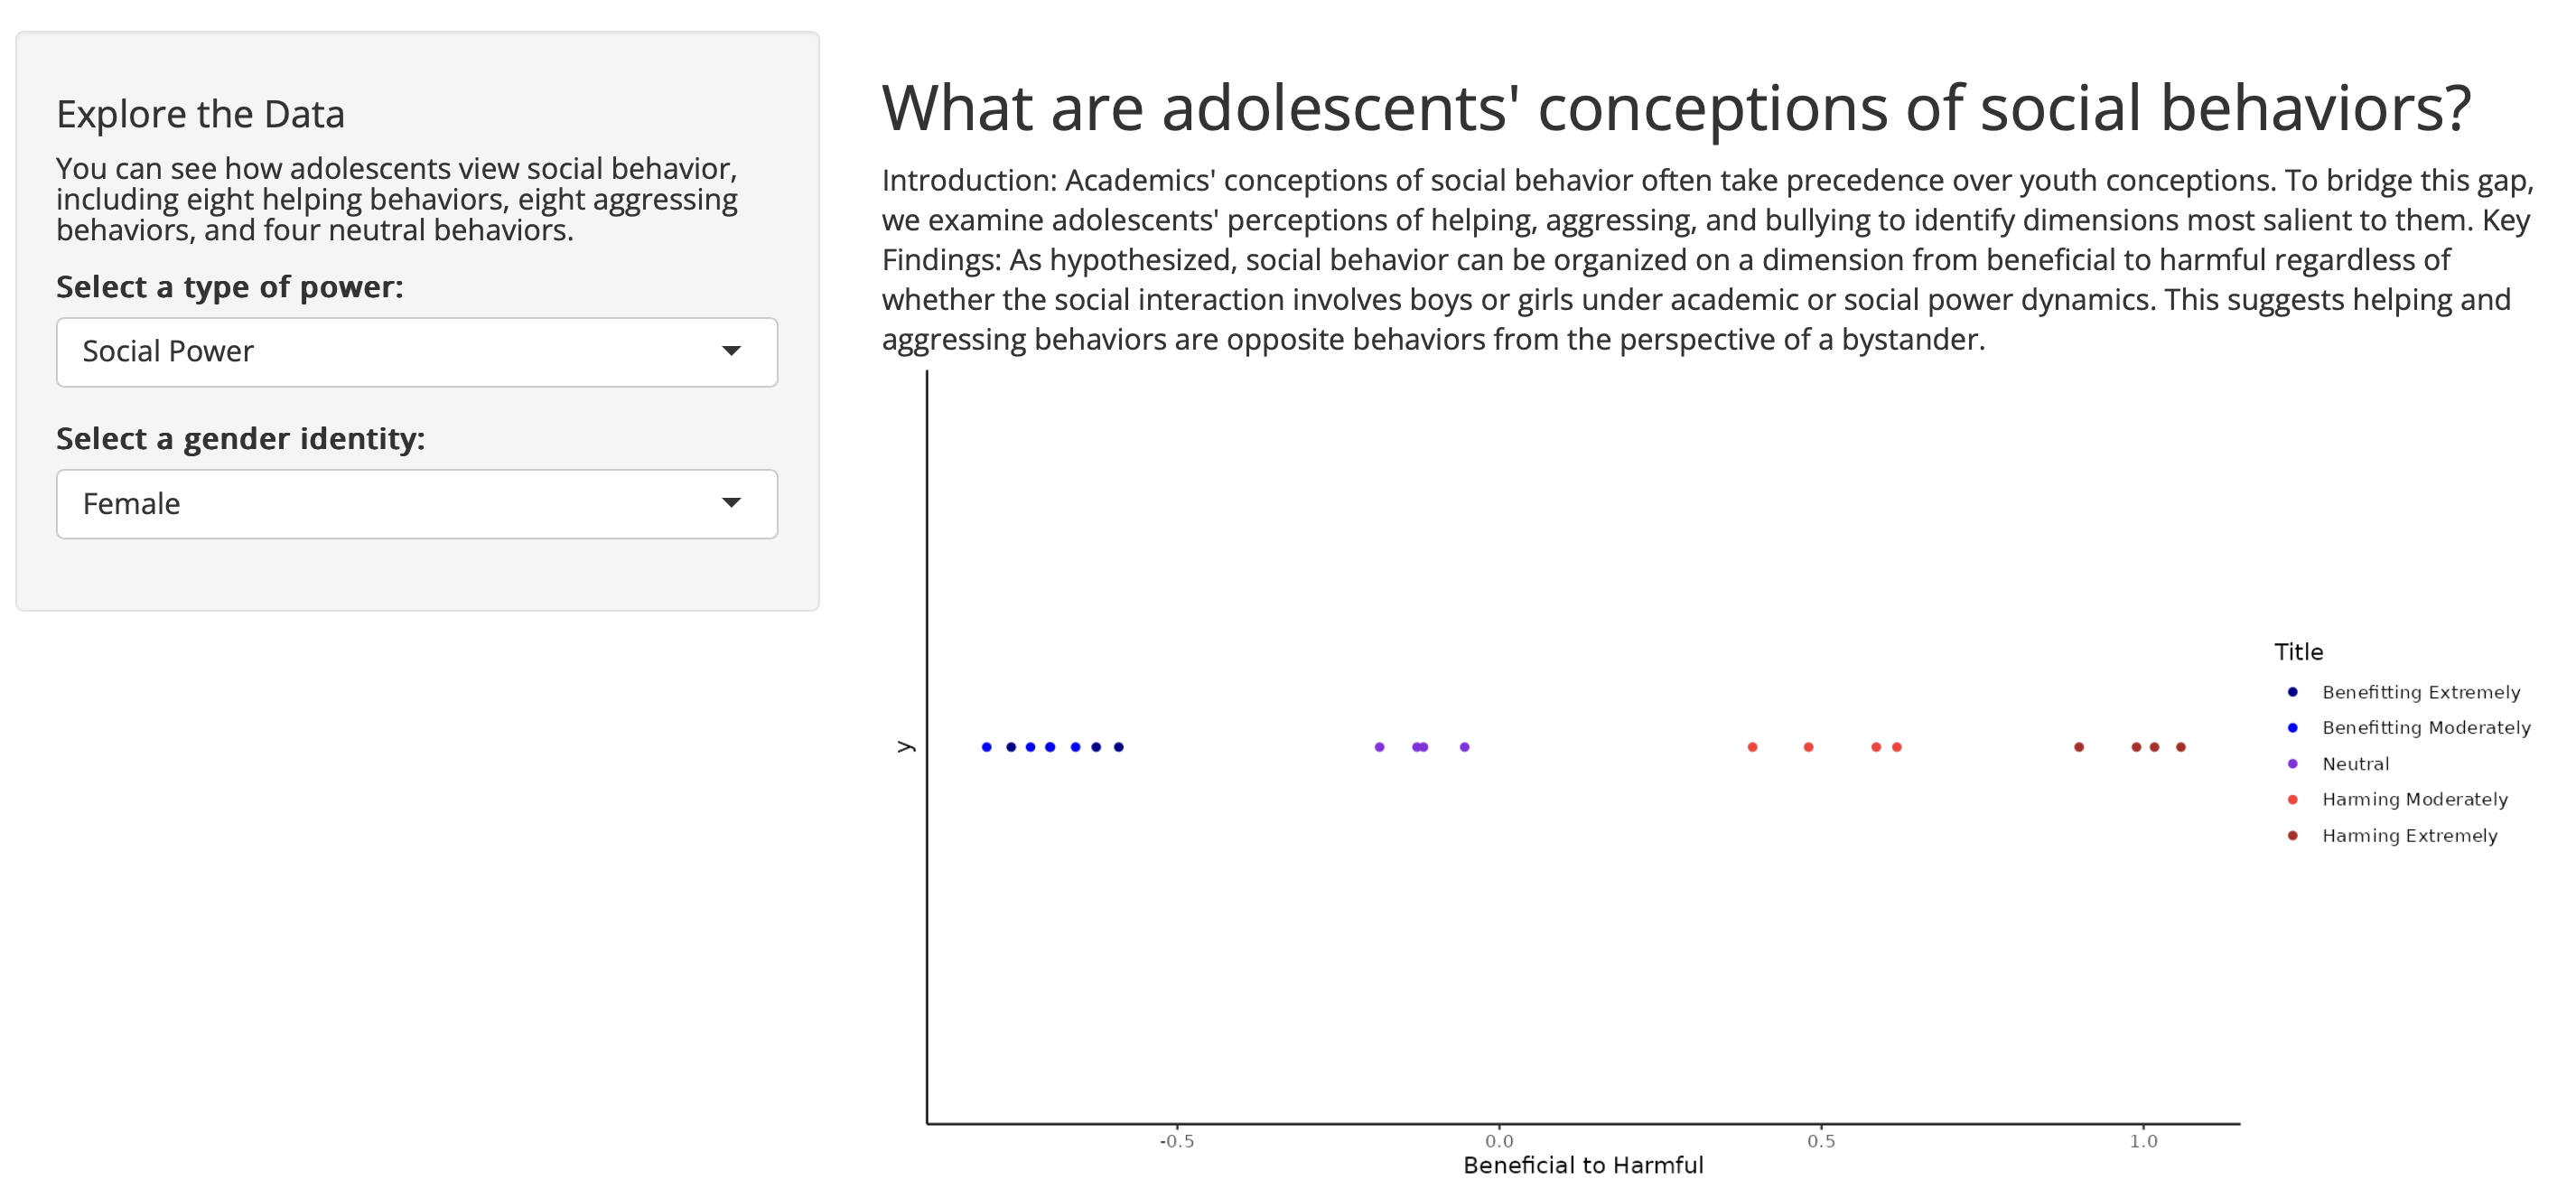
adolescent conceptions of social behavior
McCarty and Dunsmore (2022) examined the underlying dimensions of adolescents’ perceptions of helping and aggressing at school. The multi-dimensional scaling results are visualized in this R Shiny app. Bryan Acton and I created a web-based interactive tool to view the 1-dimensional, 2-dimensional, and 3-dimensional MDS results for boys vs girls and academic vs. social power.